Customer support is essential to the success of any business.
That’s no secret—the way you treat your clients can make or break your company. And you’re probably trying hard to keep your customers happy.
But how can you be sure that your efforts are paying off? Are you really providing the best possible service?
The answer lies in data.
With the help of customer service metrics, you can get a clear picture of what’s working and what’s not. We will show you what numbers to track and explain how to do it.
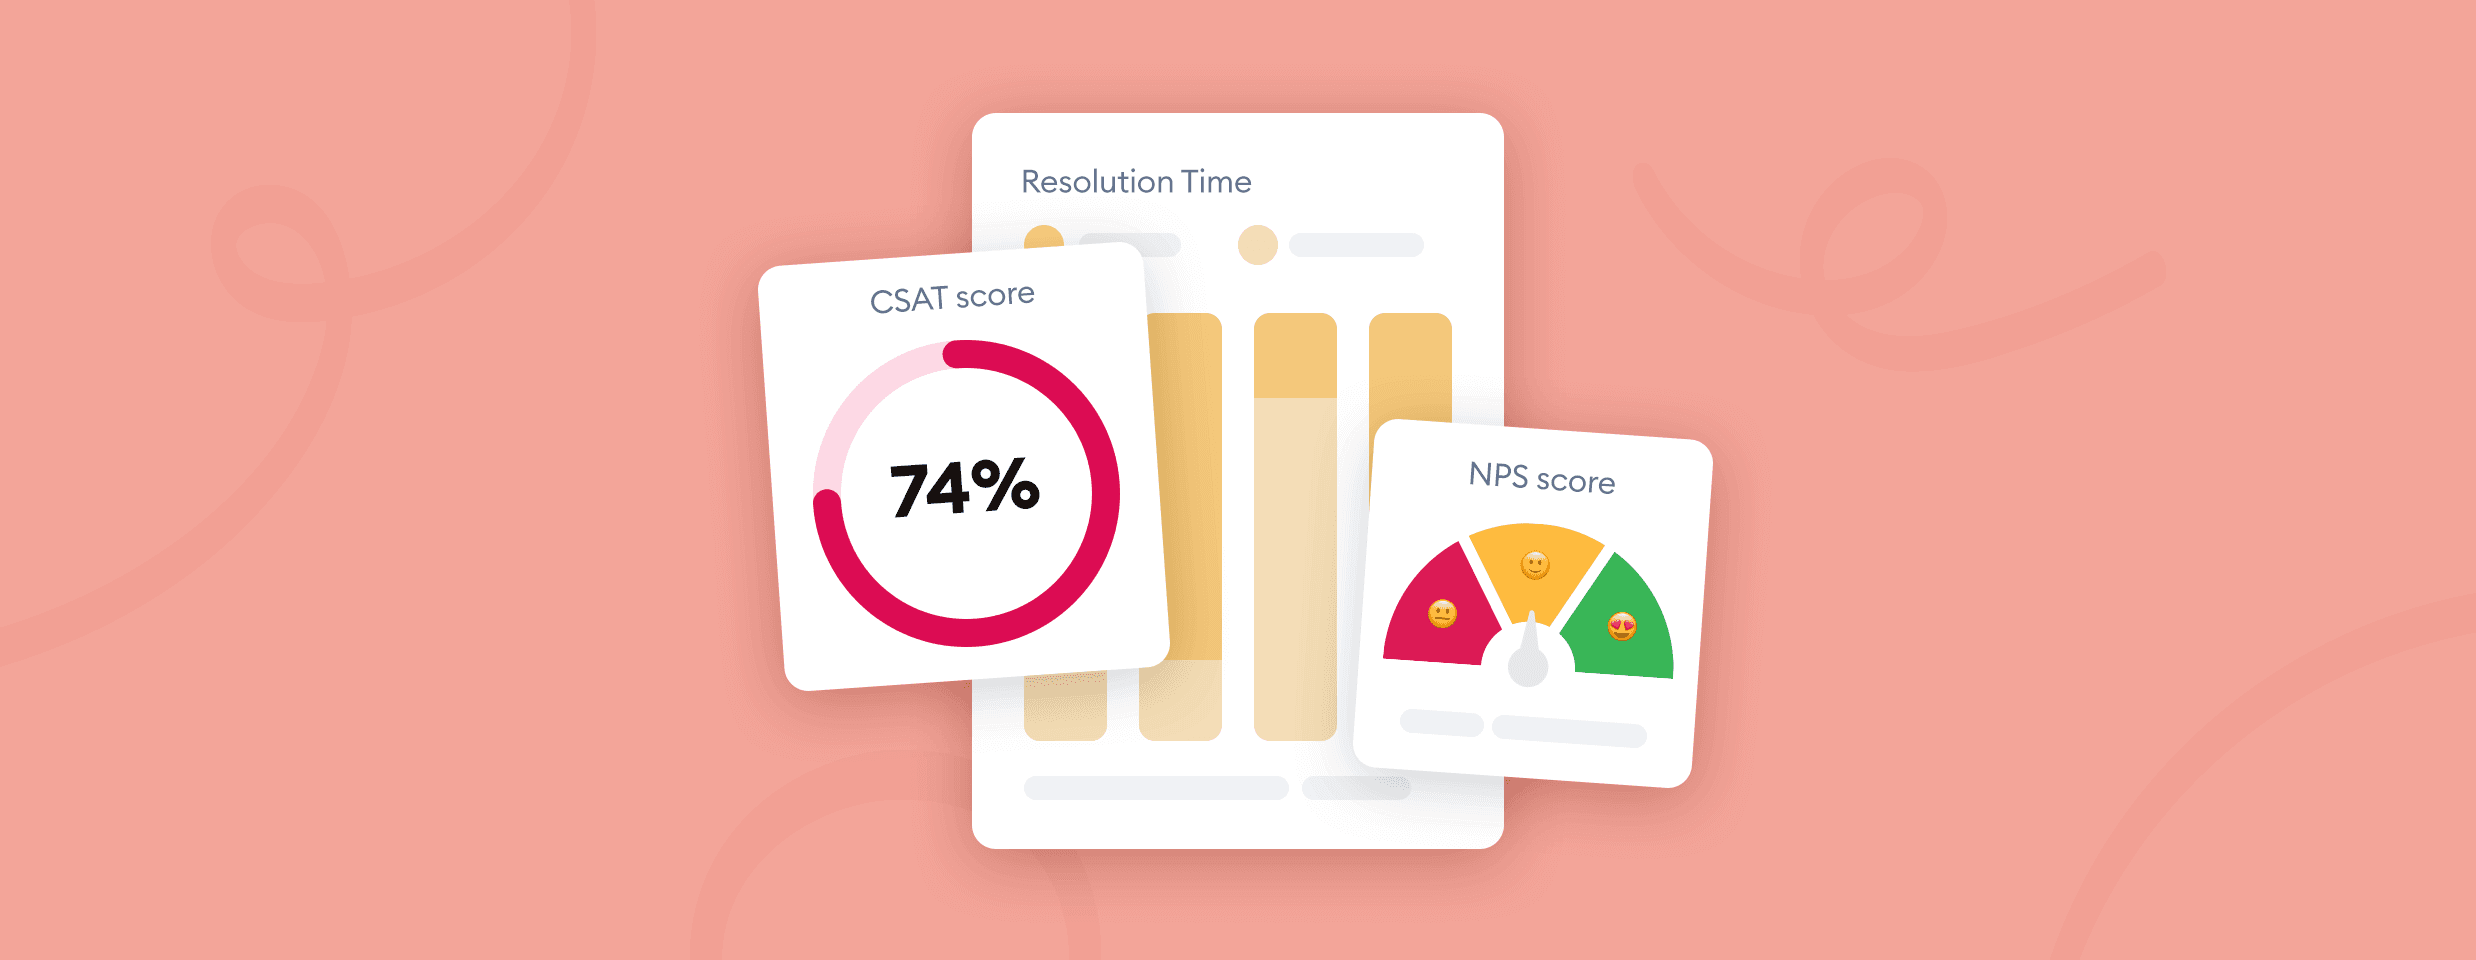
In this article, we’ll discuss the following support metrics:
- Ticket volume
- Customer Satisfaction Score (CSAT)
- Customer Effort Score (CES)
- Net Promoter Score (NPS)
- Customer churn rate
- Average response time
- Message volume per agent
- First Contact Resolution (FCR)
- Time to resolution
- Interactions per ticket
- Unresolved query backlog
- Number of escalation requests
Discover how Endeksa transformed customer service using Tidio
If you want to discover more ways to measure the effectiveness of your business, the following articles may also be of interest:
- Crucial Customer Success Metrics & KPIs
- Customer Acquisition Cost: Understanding the Killer Metric
- What is Customer Lifetime Value?
Let’s start from the beginning—
What are customer service metrics?
Customer service metrics are performance indicators used for tracking, measuring, and analyzing the efficiency of customer service teams and agents. They include things like satisfaction scores or average response time. By tracking these numbers, businesses can identify areas of improvement and take steps to optimize the customer experience.
Why these metrics are important for customer service?
It’s no secret that customer service translates into more sales. Happy customers are more likely to return, refer their friends, and buy again. Unhappy customers, on the other hand, can damage a company’s reputation with a single tweet or review.
That’s why it’s important for businesses to track team performance metrics related to customer support quality. By monitoring these metrics, you can identify problems early and take corrective action before they become bigger issues.
So, how to use KPIs (Key Performance Indicators) in customer service, and which metrics are the best? Let’s go through all of them one by one to find out.
1. Ticket volume
Ticket volume is a number of customer support requests that come in over a given period of time. This metric can be helpful in identifying trends related to customer service demand. For example, if you see a sudden spike in ticket volume, it could indicate that your product or service is having difficulties.
You can measure ticket volume in terms of the total number of tickets per day, week, or month. You can also track the number of new tickets vs. resolved tickets. This will give you a sense of whether your customer support team is keeping up with the queries.

It’s also a good idea to compare your ticket volumes against the total number of visitors or customers. If you’re seeing a high volume of tickets relative to your customer base, customers are experiencing a lot of problems.
Additionally, tickets related to specific categories of your products or services can give you insights into areas that need improvement. For example, if you sell software and a large percentage of your tickets are related to installation issues, it could be an indication that your installation process is too complicated. You can improve this by redesigning your onboarding process or providing additional documentation.

The number of tickets should display in your customer service software. If you don’t have a ticketing system, you can track this metric manually by counting the number of customer service requests that come in via email, phone, or live chat over a given period of time. However, you should consider using a solution with a built-in ticketing system to automate this process.
Discover how Endeksa transformed customer service using Tidio
Now you know how to calculate your ticket volume. But just because you have a lot of tickets doesn’t mean your shoppers are happy with the support you provide. So, what type of metrics measure customer satisfaction?
Well—
2. Customer satisfaction (CSAT)
Customer satisfaction (CSAT) is a metric that measures how happy customers are with the service they’ve received. It’s typically expressed as a percentage, and it’s based on customer responses to a question such as “How satisfied are you with your experience?”
There are a few different ways to calculate CSAT. The most common method is to take the number of customers who respond with a rating of “satisfied” or “very satisfied” and divide it by the total number of responses.
Another way to calculate CSAT is to take the sum of all ratings (on a scale from 1-5 or 1-10) and divide it by the total number of responses.

You can also use a weighted average, which gives more weight to responses from customers who had a recent interaction with customer service. This is because their feedback is more relevant and indicative of current happiness levels.
It’s important to note that customer satisfaction is different from customer loyalty. Satisfied customers may not be loyal, and vice versa. Customer satisfaction is focused on the quality of the customer service experience, while customer loyalty takes into account other factors such as product quality, price, and brand image.
Read more: How to Measure Customer Satisfaction Score for Different Businesses
3. Customer Effort Score (CES)
Customer Effort Score (CES) measures how much effort customers have to put in to resolve their issues. It’s typically expressed as a percentage, and it’s based on customer responses to a question such as “How easy was it to resolve your issue?”
The most common method is to use a 1-10 scale and count the average score. The score is then converted to a percentage.
CES is different from CSAT in a few key ways. Take a look at the example below:

| Type | Question | Evaluation | Insights |
|---|---|---|---|
| General CSAT question | How would you rate your satisfaction with your shopping experience? | Negative (because I wasn’t satisfied with the product and had to return it) | We don’t really know what went wrong without additional customer feedback |
| Specific CES question | How easy was it to return your product? | Positive (because I could return the product without any problems) | We can learn if customers find our return policies and process easy to understand and use |
CES focuses on the ease of issue resolution, while CSAT focuses on satisfaction with the overall customer experience.
This means that a helpful customer service team can earn a high CSAT score even if customers needed assistance with overcoming some difficulties. The same situation might result in a lower CES score. On the other hand, CES is not biased by how happy the customer was before contacting customer service, while CSAT may be influenced by this factor.
Read more: Learn how biased AI can be, who’s responsible for it, and more.
4. Net Promoter Score (NPS)
Net Promoter Score (NPS) is a KPI in customer service that measures customer loyalty. It’s based on shoppers’ responses to a question such as “How likely are you to recommend our company/product/service to a friend or colleague?”
Clients are typically asked to rate their likelihood on a scale from 0-10, where 0 is “not at all likely” and 10 is “extremely likely.” NPS is calculated by subtracting the percentage of customers who are “detractors” (0-6) from the percentage of customers who are “promoters” (9-10).

Keep in mind that your NPS will always be a number between -100 and +100. The closer to +100 you can get, the better for your company’s reputation.
For example, let’s say you have 100 customers and 30 of them are promoters, 60 are neutrals, and 10 are detractors. Your NPS would be 20.
| 30% – 10% = 20 NSP |
Notice that your NPS can actually become negative if you have more detractors than promoters. For example, if you had 20% of promoters and 35% of detractors, your NPS would be -15.
Interestingly, this is also a good internal metric for self-assessment of customer service teams themselves. In the context of customer service, many support departments use a variant of NPS called Employee Net Promoter Score (eNPS) to measure employees’ happines with their job. The question would be changed to “How likely are you to recommend our company/department as a great place to work?”.
Did you know …
According to a study by Qualtrics XM Institute, promoters are 4.2 times more likely to buy again and 7.2 times more likely to try a new offering compared with detractors. While NPS may seem unforgiving compared to your CSAT score, focusing on both promoters and detractors can work out for your business quite well in the long run.
5. Customer churn rate
Customer churn is the percentage of customers who stop doing business with you over a certain period of time. It’s usually expressed as a monthly or yearly rate, and it can be a good predictor of future business performance.
You can calculate your churn rate with this formula:

| For example, let’s say you had 100 customers at the beginning of the month, and 15 of them left by the end of the month. Your churn rate would be 15%. Churn rate = (15/100) * 100% = 15% |
This is one of the metrics in customer service that can show you whether your clients are happy with their shopping experience. A high churn rate might indicate that something is wrong with your product, pricing, or customer service. It can also be a sign that you’re not acquiring new customers fast enough to offset the ones who are leaving.
There are two main types of customer churn:
- Voluntary churn. It happens when customers leave on their own accord, usually because they’re unhappy with your product or service.
- Involuntary churn. Customers are forced to leave, usually because of a change in their circumstances (like moving to a new city) or changes in your business (like closing down a product line).
Sometimes, it can be difficult to separate one from the other. However, it’s a good idea to measure it and see if there is a correlation between your churn rate and customer satisfaction for particular customer segments. Asking for customer feedback will help you understand why the customers are leaving and will give you a bigger picture of your situation.
To measure your churn you usually need additional tools, such as Google Analytics. In the case of ecommerce, it is extremely hard to conclusively define a customer who has left. But in B2B churn is usually easy to measure by tracking events such as unsubscriptions or service cancellations.
Read more: How to Enable Google Analytics in Tidio
Did you know …
Churn rate is one of the key performance indicators connected with measuring customer retention. In fact, Customer Retention Rate can be viewed as a complementary metric. If your churn rate is 10% then your retention rate should be about 90%. However, it’s easier to focus on your churned customers as one segment and figure out how to prevent them from leaving. That’s why businesses use churn rate as one of the primary indicators of their performance.
6. Average response time
The average first response time is the amount of time it takes for your customer service team to respond to a customer inquiry.
It’s usually expressed in minutes or hours, and it can vary depending on the type of inquiry (e.g., live chat vs. email).

Response time is one of the most important KPIs for customer support. That’s because it’s one of the main factors that customers consider when they’re deciding whether to do business with you. Wait time can drastically affect your customer experience, so it’s important to keep an eye on this metric in all customer interactions, be it call center services, live chat, or emails. A short reply time shows that you’re responsive to customer inquiries and that you care about providing a good customer experience.ile to
According to our customer experience study, 44% of online shoppers think the average response time should be below 5 minutes.
Ideally, customers expect real-time assistance. This can seem somewhat unrealistic with channels such as email. If you’re looking to decrease your average response times, you should try live chat. On average, live chat agents send their first reply after 1 minute and 35 seconds, which is a significant improvement over email. You can check other live chat statistics to see more benefits of using this channel.
Did you know …
The majority of customer requests are just a single question. And it usually won’t help you understand the nature of their query without asking for a follow-up and additional information. That’s why it’s important to send your first reply while customers are still on your website.
7. Message volume per agent
This metric shows you how many messages and customer inquiries each member of your customer service team is handling.
It’s usually expressed as the number of messages per day, week, or month. Looking at the message volume instead of the absolute number of tickets closed can give you a better idea of how much work each agent is actually doing.

You can use this metric to get a better picture of each agent’s efforts.
Let’s say that one of your agents writes 200 messages per day while another agent writes only 10. This could be a sign that one of them deserves a raise and the other probably needs to have a chat with you. Obviously, you should look at these results in the context of other customer service measurements.
All things considered, message volume is a good indicator of team productivity. But it can also signal problems with your staffing early on.
For instance, if agents are constantly being bombarded with messages, it might be a sign that you need to hire more customer service staff. On the other hand, if agents have too much free time, it might be a sign that you’re not using your resources efficiently.
Ideally, you want to find a balance between the two.
The average message volume per agent can vary greatly depending on the industry, company size, and customer support model. For example, a small business with a few hundred customers might have an average of 10-20 messages per day per agent. A large enterprise with millions of customers might have an average of hundreds of messages per day.
Discover how Endeksa transformed customer service using Tidio
8. First contact resolution (FCR)
First contact resolution (FCR) is the percentage of customer inquiries that are resolved on the first contact. It’s also known as “first time right.”
A high FCR rate indicates that your customer service team is doing a good job of resolving customer issues on the first try. A low first contact resolution rate might indicate that your team needs more training or that your processes need to be streamlined.
There are a few different ways to calculate FCR, but here is the most common formula:

For example, let’s say you received 20 customer inquiries in a day and your team was able to resolve 15 of them on the first contact. Your FCR rate would be 75%.
The average FCR rate varies depending on the industry. According to a report by SQM Group, for call centers, the average First Call Resolution is about 70%. And you can speak of high-quality support standards when the FCR is over 75%.
First Contact Resolution is an important metric. But optimizing your FCR at all costs can have a detrimental effect on customer experiences. Make sure to keep within the requirements of your service-level agreement (SLA) and offer a good support experience.
9. Time to resolution
Time to resolution is the amount of time it takes to resolve a customer inquiry. Just like First Reply Time, this support metric is important because it has a huge impact on the customer experience.
The average time to resolution can vary depending on the type of inquiry, but in general, it should be as short as possible.
There are a few different ways to calculate time to resolution, but the most common is:

For example, let’s say it took your team a total of 8 hours to resolve 24 customer inquiries. Your average time to resolution would be 20 minutes.
Measuring the average time to solve different types of customer inquiries can give you many valuable insights. For instance, it will allow you to forecast the number of chat operators you may need to hire. The average duration of each customer interaction is also one of the best individual performance metrics for customer service agents.
Read more: How to Automate Ecommerce Support With Bots [Case Study]
10. Interactions per ticket
This metric is important because it gives you an idea of how complex customer inquiries are and how much back-and-forth is required to resolve them.
Interactions per ticket are the average number of actions necessary to close a ticket. This involves the number of times agents joined a conversation, chat transfers, or file uploads.

This metric can give you more information than just the message volume. It’s also more suitable for multichannel support because it includes all customer interactions, not just chat messages.
A typical customer journey can be very complex, and handling a customer service ticket may also involve multiple touchpoints. For example, customers reach you via phone calls, then send an email, and ultimately your team has to send them a custom proposal. If that’s the case, it may be a good idea to count the whole chain of events as one ticket with several interactions.
If your customers are frequently handed over to different teams or departments across several communication channels, consider counting the average number of interactions as one of your main customer support metrics.
11. Unresolved query backlog
The unresolved query backlog is the number of customer requests that have not yet been handled by you. This metric is important because it can help you assess the workload of your customer service team and identify potential bottlenecks.
Calculating your unresolved query backlog is simple:

For example, let’s say you have 50 open customer inquiries and your team resolves an average of 20 inquiries per day. Your backlog would be 30 inquiries (50-20).
This metric is a good way to track the progress of your customer service team. If the backlog is consistently increasing, then your team is probably not keeping up with the customer demand.
Does your team struggle with addressing each and every customer’s problem within a reasonable time period? Consider adding knowledge base management and self-service tools, such as customer service chatbots, to your website.
11. Number of escalation requests
The number of escalation requests is the number of times a customer inquiry is escalated to a higher level of support. Escalation usually happens when a customer service agent is not able to resolve an inquiry and needs to hand it off to someone with more knowledge or authority.
From a customer’s perspective, being transferred to another agent or department may create frustration and lengthen the time it takes to get their inquiry resolved. This can quickly turn into a customer service horror story, especially if your customers have to explain the same problem multiple times to several different support team members. Having to repeat the information across different departments is the number one pet peeve for about 21% of customers.
To calculate your customer request escalation rate, simply divide the total number of inquiries that were escalated by the total number of inquiries that were received.

This metric is important because it can help you assess the knowledge and training of your customer service team. If you’re seeing a lot of escalation requests, then it may be an indication that your agents are not properly equipped to handle some tickets.
Escalation requests can also be an indicator of poor customer service. If customers feel like they’re not getting the help they need from a specific support agent, they may be more likely to escalate their inquiry.
KPI examples for customer service
Support teams can decide on which KPI metrics for customer service to use. They usually mix and match different KPIs to measure their performance in the most suitable way.
There are a few core KPIs that customer service teams can use to measure their success and progress. As we mentioned before, some of them include customer satisfaction rates, first contact resolution rates, and average handle time. Additionally, teams can also track the number of support tickets closed per month or per week.
When deciding on quarterly goals, it’s best to focus on a few key customer support KPIs that will have the biggest impact on the team’s overall performance.
Take a look at customer service KPIs listed below:
| An example of quarterly KPIs used by a customer support team at a startup company CSAT ≥ 60% First Reply Time < 2:00 Employer Net Promoter Score (eNPS) ≥ 40 |
Choose up to four customer service metrics, and make sure that your team members are aware of these goals and working towards them. When you get clear objectives right in the beginning, managing expectations and trying to improve your results will be much easier.
Additionally, consider setting individual performance metrics for different team members based on their skills, strengths, and experience.
But—
Is there one metric for measuring customer support performance to “rule them all”?

A survey conducted among contact center professionals revealed that CSAT is perceived as the single most important measure of success. It was picked by 47% of people working in customer support. First Contact Resolution was also a popular choice, with 23% of respondents perceiving it as the crucial customer service metric.
How to measure customer service performance?
There are many tools and strategies for collecting customer feedback and measuring customer service performance. Some companies choose to measure customer satisfaction with surveys, while others track customer retention rates with their sales and business intelligence tools.
You can gather data proactively, for example, by engaging customers with pop-ups, or passively, for instance by going over chatbot conversation analytics.

No matter what method you choose, it’s important to focus on the quality of your data and not just the quantity. In other words, don’t just collect feedback for the sake of it—make sure you’re actually using the insights to improve your processes.
Discover how Endeksa transformed customer service using Tidio
Here are some of the most popular methods:
Let’s see what are the pros and cons of each method and how you can implement them.
Surveys
You can send out post-chat or post-call surveys to customers after they’ve interacted with your support team. This method is popular because it’s relatively easy to set up and execute. All you need is a list of questions and a way to distribute the survey (usually via email).

The downside of surveys is that they’re often long and time-consuming, which can lead to low response rates. In addition, they can be biased if customers only answer the questions they want to or if they don’t have time to provide a detailed response.
Read more: How to Design a Customer Satisfaction Survey: Sample Questions & Guide
Live chat
Another popular method for measuring customer service performance is live chat. Not only is it a powerful tool for real-time support, but it also provides valuable insights into the performance of your chat operators.

Many live chat solutions come with built-in reporting features that track many customer support KPIs like average response time, message volume, or the number of handled vs. missed conversations. This data can be extremely helpful for assessing chat operator performance and identifying areas for improvement.
Chatbots
If you have a chatbot on your website or in your mobile app, you can use it to collect customer feedback and measure customer service performance. Customers can also rate the quality and helpfulness of chatbot messages by upvoting and downvoting them.
With tools such as Tidio, you get an all-in-one tool you can use to build bot conversation workflows and collect feedback.

It’s possible to use chatbots for sending CSAT surveys or asking questions linked with other metrics. For example, you can ask customers to rate their support experience on a scale of 0 to 10 or invite them to leave a review on your social media. You can also use chatbot analytics to track customer satisfaction over time or compare it across different channels.
CRM
CRM systems usually have many out-of-the-box features for measuring customer service performance. For example, you can use default dashboards to track the number of support tickets created, solved, or closed, the average response time, or the number of escalations.

In addition, CRM systems often come with surveys and reporting features that can be used to collect customer feedback and measure their satisfaction levels. You can weaponize CRM data to segment your customers and target them with specific surveys or follow-up questions. For example, you might send a survey to customers who have been waiting more than 24 hours for a response to their support ticket.
Professional CRMs and ticket management solutions can help you get better results in no time.
Social media
Ratings and reviews on social media can be a powerful way to measure customer satisfaction. A high number of positive reviews and comments can be a good indicator that your customer service is performing well.

In addition, social media can be used to collect customer feedback in real-time. You can set up keyword alerts to track mentions of your company or specific keywords related to your customer service. Setting up custom automations (for example, Instagram bots for automatic DM replies) can also help you gain more insights about your customers and measure their satisfaction levels.
Key takeaway
Customer service metrics can help businesses track the effectiveness of their operations. Additionally, they can help identify areas where they need to make adjustments, as well as measure the impact.
Customer support metrics can also help businesses predict future customer needs and demands. By collecting and analyzing them, businesses can improve their overall performance and keep their customers content.
Some of the most important customer service metrics include first contact resolution rate, net promoter score, and customer effort score. Additionally, businesses should also track customer satisfaction, customer churn, and the number of messages and interactions per ticket.
The most popular KPIs used by customer service teams are:
| Ticket volume | The number of customer service inquiries or requests that come in |
| Customer Satisfaction Score (CSAT) | How happy customers are with a product or service |
| Customer Effort Score (CES) | How much effort a customer had to put forth to resolve their inquiry or request |
| Net Promoter Score (NPS) | How many people would recommend your product or service |
| Customer churn rate | The percentage of customers who stop doing business with a company over a specific time frame |
| Average response time | The average amount of time it takes for customer service agents to respond to inquiries |
| Message volume per agent | The number of messages an agent receives in a given period of time |
| First Contact Resolution (FCR) | The percentage of customer service inquiries or requests that are resolved on the first contact with the customer service team |
| Time to resolution | The total time it takes to resolve customer service queries |
| Interactions per ticket | The number of interactions (phone calls, emails, live chats, etc.) that are required to resolve a customer ticket |
| Unresolved query backlog | The number of customer service inquiries or requests that remain unresolved |
| Number of escalation requests | The number of times requests are escalated to higher levels of support |
Online companies can measure customer service metrics in a number of ways, including surveys, live chat, chatbots, and chat analytics. Additionally, businesses can use data mining techniques to monitor customer service interactions and extract insights.
So—
Are you ready to start improving your results with one of the best all-in-one customer service tools?